A Socratic Dialogue on Comparison of Measures Will G Sportscience 14, 15-21, 2010 (sportsci.org/2010/wghmeasures.htm) Sport and Recreation, AUT University,
Auckland 0627, New Zealand. Email. Reviewer: Alan
M Batterham, School of Health and Social Care, University of Teesside,
Middlesbrough TS1 3BA, UK. |
|
This article is an augmented
version of the script for my contribution to a conversational forum with the
title Limits of Disagreement in Measurement
Studies: Socrates vs Sophist, presented
at the 57th Annual Meeting of the American College of Sports Medicine in Baltimore,
June 5, 2010. Alan Batterham proposed the session and chaired it. I devised
this script and played the role of Socrates. My PhD student Brett Smith was
Plato. The other contributor to the
session was Doug Altman; his contribution is not shown here. The images and figures shown in the article
are available as slides. Xenophon: Hail Socrates! Welcome to this forum of citizens interested in comparing measures. Socrates: Hail Xenophon! Thank you for the invitation. I hope to convince our citizens that for the last 20 years they should have been using linear regression to compare measures (see, for example, Paton and Hopkins, 2001), not the approach of those statistical sophists, Bland and Altman (1986). I have prepared some helpful images for display on this state-of-the-art parchment. My pupil Plato will also assist me. Plato, hail! When he is not reflecting on the ideal republic, Plato studies the training and performance of our oarsmen. Here is an image of our oarsmen in action. May they be forever victorious over the Assyrians!
Plato, you have a problem that will help me make my case. As you know, our oarsmen are all free citizens who must take time from their normal duties to train. Some think that athletic prowess is a gift of Apollo, and that training serves only to waste time and make men tired. Others say that training is important, and that training for the sports at Olympia will transfer to the boats.
So, how should our citizens train, or should they even train at all? This is a difficult issue that thought alone cannot resolve. You must do some empirical research, Plato. For the purposes of this meeting, let us leave aside the question of the merits of the different kinds of study design. Let us consider for now one of the simplest, a cross-sectional study of the relationship between training and performance. Empirical research needs data, and data come from measurements. What measurements will you need to address questions about the relationship between training and performance? Plato: Measurements of training and performance, of course! Socrates: Exactly! And how will you measure these? Plato: Uuhhh… For performance, we can line the men up in the single-scull training boats and race them. The order in which the boats cross the finish line will tell us practically all we need to know about performance. Socrates: Yes, yes, performance is no problem here. What about training? How will you measure that? Plato: Our citizens exercise and train at various times of the day at various venues. I cannot be everywhere at once to observe their training, and we will have to wait for thousands of years to get trustworthy technology to monitor their activities precisely. Socrates: Will we ever have such technology?! And if we did, could you afford more than a few devices? And would wearing them cause our citizens to change their training? Plato: Oh, yes, I suppose so. Hmm…. I know, I'll just ask each citizen to report on how much training they do to get a good idea of their usual training. Socrates: A self-report of physical activity is certainly a practical solution to getting data quickly from hundreds of citizens. What should we call such a measure? Plato: A practical measure, Socrates? Socrates: Brilliant, Plato! But what is the main problem with such a practical measure? Plato: Well, it won't tell us exactly what training our citizens have done. It will have errors. Socrates: How could you determine whether the errors are worth worrying about? Plato: I could choose some citizens at random and get their slaves to write down what training their masters are doing each day. Socrates: Will the measure of activity provided by the slaves tell you exactly how the citizens are training? Will it be perfect? Plato: Let's assume it will be near enough to perfect. Nothing is perfect, Socrates, unless it be some abstract ideal. Socrates: Let's keep to reality for now, please! What about a name for this near-perfect measure? Plato: We can't call it perfect, but we might be forgiven for calling it the true measure of training. Failing that, it certainly sets some kind of gold-standard or criterion for what we are trying to measure. Socrates: All those names will do nicely. Now let's see how we can check the practical against the criterion. Let's imagine you have the data from a representative sample of our citizens. We have two measures, the practical and the criterion. To get the best idea of the relationship between them, we must take a giant leap forward nearly 2000 years to another great philosopher, Renee Descartes. How will he deal with the problem of displaying values for two measures? Plato: Are you referring to the Cartesian geometry we will one day learn in grade school, Socrates? Socrates: Indeed. Let's put the practical along the X axis and the criterion up the Y axis. A single point on this plot represents the amount of training one of our citizens reported (the practical value) and the amount observed and recorded by his slave (the criterion value). But hold! Are the axes the right way around?
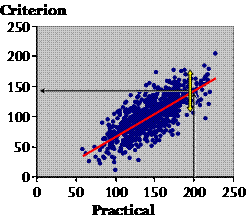
Plato: Shouldn't the criterion go along the X axis? Isn't the practical dependent on the criterion? Socrates: Not really. To see why, let's add the training data for hundreds of citizens. [These data were generated with a spreadsheet similar to that in Hopkins (2004).]
The first thing we want to do with these data is make use of them somehow in future to correct or calibrate the practical measure–to make it as close to the criterion as possible. This straight red line does the job. It's the regression line of Y (the criterion) on X (the practical), and the equation of the line is a calibration equation to calibrate or convert the practical to the criterion. I've created data that work best with a straight line, but you can fit a curve if the data call for it. If we have a citizen's value of training, and we want to convert it to the criterion value, we make the least error on average by using this line to do the conversion. You see: on average, the true values are evenly scattered in the up-and-down direction each side of the line. So the prediction is right on average, but the scatter represents the error you can make with any given individual. Is the scatter the same all the way along the line, Plato?
Plato: Of course not. I can see that there is less scatter at the ends. Socrates: Appearances can be deceptive, Plato. It looks that way only because there are less points at the ends. If you measure the scatter as a standard deviation, it's the same all the way along. It may not be that way with real data, of course, but this is the kind of picture you get with real data when the scatter is truly the same. And when we calculate the scatter as a standard deviation, we assume it is the same. The standard deviation is known as the standard error of the estimate. I prefer typical error of the estimate, because, well, it's the typical error in an estimate of an individual's criterion value. If the scatter changes as you go along the line, it's called heteroscedasticity, or non-uniform scatter. When that happens, you try to find a transformation of the practical and criterion that makes the scatter uniform. Log transformation often takes care of scatter that gets bigger for bigger values, and you end up expressing the error in percent units, a coefficient of variation. Now Plato, I want you to call your attention to something. We have calculated a standard deviation representing a random error, and it looks like it's an error in the criterion. But the criterion is supposed to be near enough to the true value of each citizen's training. It's not supposed to have error. Isn't the error in the practical? What's going on? Plato: Yeah, the error is definitely in the practical, not the criterion. This must be some kind of statistical trick. Socrates: Well, sort of. The error is in the predicted value. It doesn't mean the error is in the criterion itself. It just means that error in the practical turns up as an error in the predicted value of the criterion. If there is no error in the criterion, you can estimate the error in the practical by putting the criterion on the X axis and the practical on the Y axis. This approach would be a good way to compare practical measures from different studies, provided the practical measures are all in the same units. No time for that now. Let's look at another aspect of this relationship.
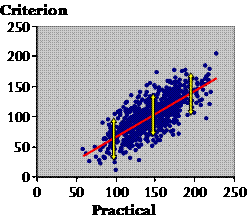
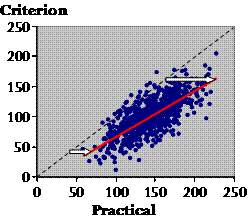
Do you notice anything about the overall trend revealed by the red line? It's easier to see if I add the line of identity.
Plato: It looks like the practical values are generally larger than their criterion values. And the gap is wider for the larger practical values. Socrates: Indeed. You can see that citizens on average report larger amounts of training than they really do. That's called a systematic error or bias in the practical value. And with these data, those who report most training exaggerate the most (see the white arrows). That's called proportional bias. If you have proportional bias and increasing scatter with larger values, chances are you should use log transformation for the analysis. Right, we've dealt with typical error, the calibration equation, and the bias. There is one other important statistic to describe the relationship between the practical and the criterion, or any two continuous variables for that matter. Any idea what I'm talking about? Plato: Not the correlation coefficient? Socrates: Yes, yes, the good old correlation coefficient.
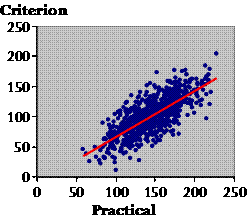
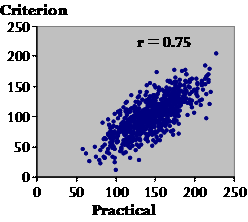
It's a wonderful summary of the overall amount of scatter in that plot. It doesn't matter what the actual values of the practical and criterion are, or which way around you plot them. If you have a thin loaf of points on an angle, the correlation is high and it's a good practical. If you have a fat loaf, the correlation is low and it's a bad practical, although it depends somewhat on what you're using the practical for. This correlation, 0.75, is acceptable for some population studies. You'd make a lot of mistakes if you used it on its own to rank or select individuals on the basis of their practical values. For that you need correlations closer to 1.0 (Hopkins and Manly, 1989). But even correlations less than 0.75 would provide useful evidence for a clinician developing a diagnosis in a Bayesian fashion with an individual patient. Do physicians ask patients how active they are, Plato? Plato: Of course they do, Socrates. Socrates: And what do you suppose the validity correlation would be for the answers to that simple question? Plato: Probably much worse than this one. Socrates: Yes, I agree, but does the physician nevertheless get useful evidence from it to assist in the diagnosis? Plato: Presumably. Socrates: Indeed, a point Bland and Altman failed to make in their criticism of the correlation coefficient. I make a big deal about the correlation between the practical and criterion, because the smaller the correlation, the more the effects involving the practical are degraded or attenuated. But you can use the validity correlation to correct the attenuation. So much for what will be known one day as the regression approach to analysis of validity studies. There's much more we could talk about, but time is against us, and I now have to deal with the Bland-Altman approach. Suppose the ethos forum won't let you use slaves to get the criterion measure of training. Can you get it another way? Who else might know what training each citizen is doing? Plato: I suppose the best person would be a wife or concubine. Socrates: OK, so suppose you ask their womenfolk what training their men are doing. Do women know more about what their men do than the men themselves? Plato: That is an open question, Socrates. Maybe it is no accident that we have a goddess of wisdom, Athena, not a god. Only She can answer that, and I am not sure I would believe Her answer. Socrates: Agreed! So, suppose you have two measures, and you are not sure which is the better measure. Why would you want to compare them? Plato: Well, it would be nice to know if they are near enough to identical. You could then use either with complete confidence. Socrates: Or neither with any confidence! Anyway, Bland and Altman came up with a method of seeing whether or not the two measures were interchangeable. Plato: That would seem to be a useful method, Socrates. Socrates: I suppose Bland and Altman thought so too, but is it really? What good does it do you to know whether or not two measures are interchangeable, if you don't know whether either is any good? What's more, researchers almost invariably have a criterion they're using to validate another measure, in my reading of the literature, anyway. There are also many calibration-type validity studies where the criterion is in different units from those of the practical, and for these the Bland-Altman approach can't be used. So why use it at all? Plato: OK, but if the measures are in the same units, can't you use the Bland-Altman method to see if the practical can replace the criterion? Socrates: Well, no, actually. Let's see why.
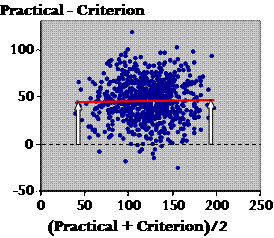
Here is the start of a Bland-Altman plot, which is supposed to tell you all about the interchangeability of two measures. Up the vertical axis you put the difference between the measures, and on the horizontal axis you put their mean. I've dotted in zero difference, which is the ideal result for interchangeability. And now here are our previous data:
There are several points to make here. First, what can tell me about the scatter, Plato? Plato: Well, the fact that there is any scatter at all means that the measures aren't identical. Socrates: Oh very clever! Yes, there's always a difference between two measures for any and every individual. In fact, though, these Bland-Altman plots all look very similar when it comes to the scatter, because researchers adjust the scale of the Y axis to fill the graph with the points. You can't tell, just by looking at it, whether the scatter represents important differences. You can tell with a regression plot, or the correlation coefficient. OK, so much for the scatter. Now what about where the points fall generally in relation to the zero line? Plato: The practical is greater than the criterion? Socrates: Yes. Is the difference important? Plato: Same problem as for the scatter–we can't tell from this plot. Socrates: Agreed. Now what about proportional bias? Is there a bigger difference at one end than the other? Plato: It doesn't look like it. How can we tell for sure? Socrates: Let's draw the line of best fit...
The white arrows represent the bias at each end of the range of values. You're right. The red line is almost dead flat. So there's no proportional bias? Plato: But didn't these data show some proportional bias in the regression analysis? Socrates: Yes, bias in a regression plot differs from that in a Bland-Altman plot. The regression plot shows the correct bias, and the regression equation corrects the bias. A Bland-Altman plot of the corrected practical still shows bias, even though there is none in reality (Hopkins, 2004). This artifactual bias in the Bland-Altman plot depends on the relative noise in the two measures. For want of time, I won't critique the limits of agreement, which Bland and Altman added to their plot as a reference interval for the difference between measures. But I will finish with a few rhetorical questions about them. • Don't citizens–myself included–struggle with the idea of a reference interval for interchangeability? • Isn't the concept of a typical uncertainty (error) in the predicted true value far more intuitive and practical? • If a measure is not interchangeable with a criterion according to the limits of agreement, isn't it nevertheless useful for assessing individuals and for sample-based research? I have calculated that to pass the Bland-Altman test of interchangeability, the validity correlation has to be at least 0.995 (see Note). Doesn't that seem just a bit too high? • Doesn't untrustworthy bias in the Bland-Altman plot mean untrustworthy limits of agreement? • Aren't researchers almost always interested in identifying the best practical measure? A series of Bland-Altman analyses does not address this issue, but a comparison of the regression statistics each measure has with a criterion does the trick. If none of the measures is a criterion, a good candidate for the best measure is the one with the highest mean correlation with every other measure. Measures that demonstrate construct validity and that are therefore expected to have only modest correlations with the primary practical measures under consideration can be included in the calculations of the means (e.g., Hopkins et al., 1991). • And finally, therefore, if a measures-comparison manuscript came to me for review, wouldn't I be justified in insisting on removal of all mention of limits of agreement? Acknowledgments. The idea for this dialogue emerged after I used the Socratic approach to teach the concepts of validity to Saeideh Aminian, one of the PhD students at AUT. Lina Wahlgren graciously agreed to be the student in a trial presentation to a group at the Swedish School of Sport and Health Sciences (Gymnastik- och idrottshögskolan, GIH) in Stockholm in May. Brett Smith risked public ridicule by playing the part of Plato for the presentation at ACSM. My thanks to these three students. Note on the Correlation Between Measures in AgreementAs far as I can tell, Bland and Altman would say that two measures were in acceptable agreement if the mean difference plus or minus 1.96 of the SD of the difference scores (SDdiff) is a trivial difference. Let's assume that the mean difference (the mean bias) is negligible and that non-trivial differences are anything more than the default smallest important difference of 0.20 of the between-subject SD. If in addition (and to simplify matters), one measure is an error-free criterion, and the other measure is a practical with the same values but with the addition of a random error, then the SD of the random error must be SDdiff. The definition of the correlation between two variables is their covariance divided by their standard deviations. If the SD of the criterion is SDcrit, then SDprac = √(SDcrit2+SDdiff2), and the covariance is SDcrit2. Therefore r = SDcrit2/(SDcrit√(SDcrit2+SDdiff2)) = 1/√(1+SDdiff2/SDcrit2). But for acceptable limits of agreement, 1.96´SDdiff = 0.2´SDcrit. Therefore r = 1/√(1+0.12) = 1/1.005 = 0.995. ReferencesBland JM, Altman DG (1986). Statistical methods for assessing agreement between two methods of clinical measurement. Lancet i, 307-310 Hopkins WG, Manly BFJ (1989). Errors in assigning grades based on tests of finite validity. Research Quarterly for Exercise and Sport 60, 180-182 Hopkins WG, Wilson NC, Russell DG (1991). Validation of the physical activity instrument for the Life in New Zealand national survey. American Journal of Epidemiology 133, 73-82 Hopkins WG (2004). Bias in Bland-Altman but not regression validity analyses. Sportscience 8, 42-46 Paton CD, Hopkins WG (2001). Tests of cycling performance. Sports Medicine 31, 489-496 Published June
2010 ©2010 |